Location Strategy and Selection Services
Gray location strategy and selection answers three “simple” questions:
- What results must be achieved to have a successful campus?
- Starts
- Completions
- Placement
- Profit
- Which locations can achieve these results?
- Of these locations, which ones are convenient for students?
- Public transportation
- Goods and services
- Safety
- Employers, especially for clinical sites
Gray answers these questions using leading-edge databases and advanced analytics.
- Benchmark Campus: Location work must start with clear targets for school size and real estate. We work with our clients to benchmark their current campuses and build models that determine the required number of inquiries, starts, students and placements.
- Demand: Inquiry Maps: GrayReports provides relevant, consistent, geo-coded data on inquiries, completions, and demographics.
- Demand: Max DADI: Using Gray’s Distance-Adjusted Inquiry Index (DADI), we determine the area that is closest to most inquiries.
- Demand: Custom Start Models: We build statistical models that predict our client’s potential starts using demographic data, competitive data, and historical start files. We use these models to predict the number of starts you would win from each potential site in a city.
- Convenience: Descriptive Maps: We create maps of employers, transportation, crime, walkability, and traffic to assess the site’s convenience.
- Placement: A healthy employment market is critical to ensure that the new location complies with Gainful Employment regulation. Gray integrates employment predictions from BLS, job posting from WANTED Analytics, and our data on over 10,000 completion rates to size the employment market and placement opportunities.
- One-Page Summary: We provide management with a clear, one-page summary of the potential size of each campus and all other key factors.
Illustrative Deliverables
1. Benchmark Campus
There is a critical first step in location selection that is often skipped. You must know the admissions, operations, and placement characteristics of a successful location. This step need not be complicated—you may simply choose a current high-performing campus and use its metrics. Since few campuses are successful on every metric, you need a somewhat more complex combination of attributes from several campuses to create your “Benchmark Campus.” As illustrated below, these metrics then become the benchmarks that any new location must meet or exceed.
In this case, the new location must be in a market with at least 50,000 inquiries for its programs. This inquiry volume should enable the school to achieve 525 starts. Given this volume of starts, one would expect 170 completions. This leads to a critical constraint: given the school’s placement target of 88%, it must be able to place at least 150 graduates a year.
2. Inquiry Maps
Our inquiry maps are unique. We have agreements with major aggregators and agencies who share their inquiry data with us. This dataset now includes over 37 million inquiries, covering hundreds of cities and programs. Further, most inquiry maps are at the zip-code level; ours are at the census-tract level, which is nearly twice as precise. We also include competitors on these maps—scaled by their enrollment or, in this case, by their change in enrollment (2011 vs. 2012).
But seeing where demand comes from by census tract does not answer the question—where would the most students be willing to travel to go to school?
3. Max DADI
To determine this location, Gray creates a Distance-Adjusted Demand Index (DADI)—essentially the distance-weighted inquiry volume from each tract to every other tract in a city. The tracts with the highest DADI scores closer to more inquiries or predicted starts than all other locations in the city. We can also see how far off-peak every other location is—in this case, each change in color shows a 2-3% drop in DADI at the high end (greens) and a 10% swing below that. In this case, the fastest growing campus (+7%) is also in the Max DADI area, while those outside this area tend to be shrinking.
We know that each school’s students, brand, and marketing are unique. So, inquiry maps and max-DADI scores, by themselves can’t answer the question: how many students will I be able to attract?
4. Custom Start Models
To answer this question, we create custom statistical models that predict starts for your current and potential future campuses. First, your starts are mapped to census tracts and compared to over 300 census variables, competitive completions, and distance from campus. Our statisticians use this information to build custom models of the relationship between your starts and distance, demographics and competition. Your model can then be used to predict starts for a new city, a new location, or for the re-location of an existing campus. In addition, the models allow you to understand the uncertainty of the prediction, so you have a sense of the location risk.
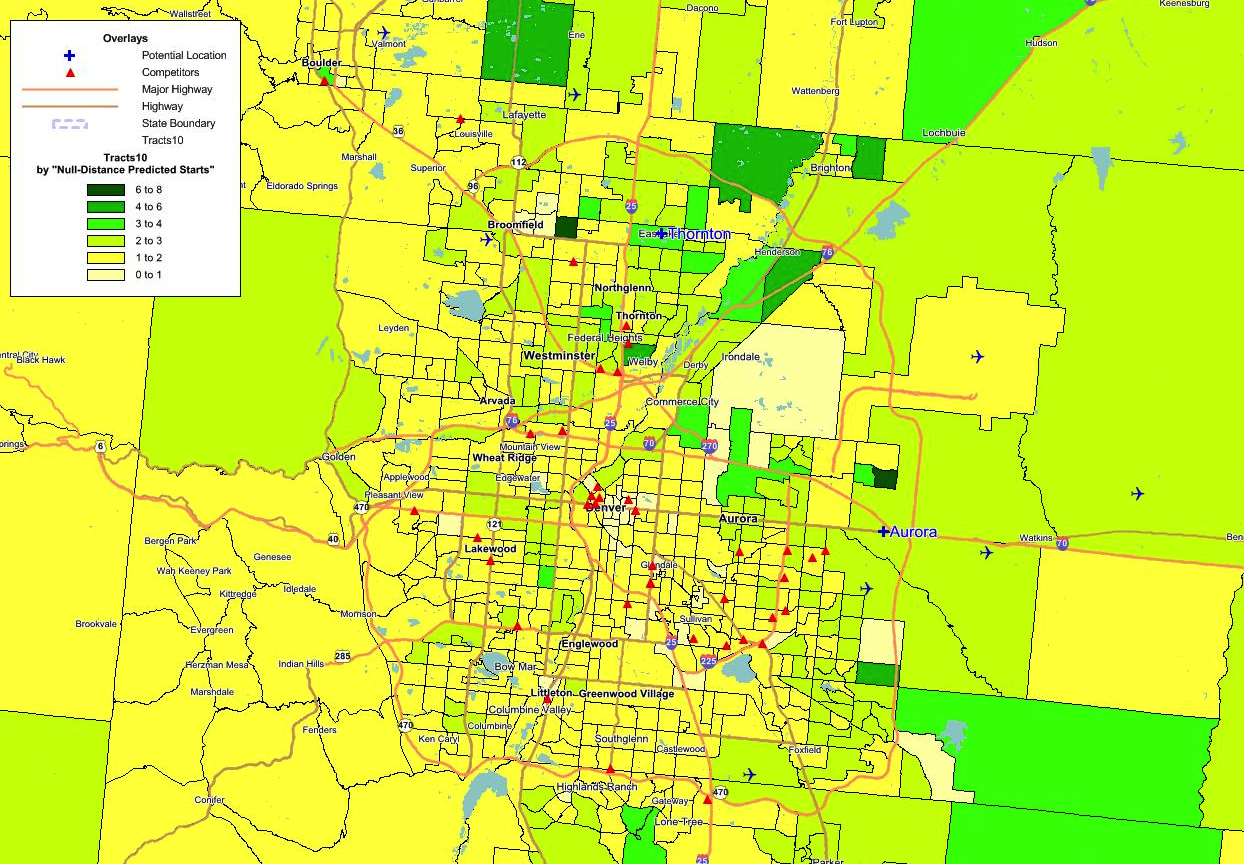
Like the Inquiry analysis, the custom models produce heat maps that show the areas demand will come from, but in this case the maps reflect the unique aspects of your students and your brand.
In addition to these general maps of predicted starts, the models estimate the predicted number of starts you are likely to get at a specific site.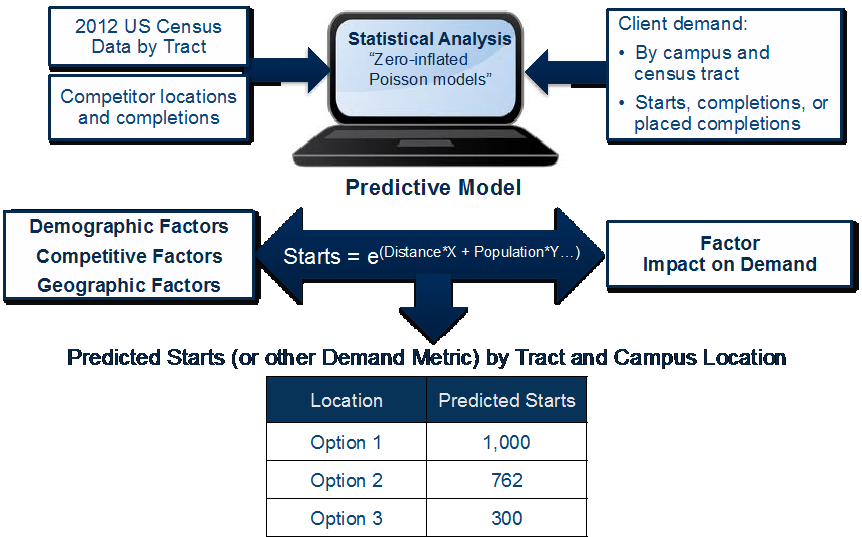
5. Convenience and Descriptive Maps
We also explore the area near the site to be sure it will be convenient and safe for students. The local Walk Score, summarizes the stores and services near the site, such as transportation and restaurants. It is important that the neighborhood is safe, so we also map local crime rates. To evaluate access to employers we map their locations for each program and employer type. Traffic counts and public transportation maps are also provided.
6. Placement
In today’s regulatory environment, access to sites for internships and clinical rotations is very important, especially in healthcare. As part of site selection, we size the local employment market, pull local placement rates from our databases, and map relevant employers.
In our view, actual placement rates for competing schools offering your programs are the best indicator of employment market health. If the average rate in the local market for your programs declines to 70% or below, placing additional students will likely be a challenge.
Using BLS, we also track job openings for your programs in the local market. We compare BLS projected job openings to the number of graduates, to create our Job Opportunities per Graduate (JOG ratio). When there are more jobs than grads (JOG>1) the employment outlook is healthy. However, placement results often exceed—by a wide margin—what BLS would suggest. Therefore, we strongly advise using BLS data only in combination with actual placement results.
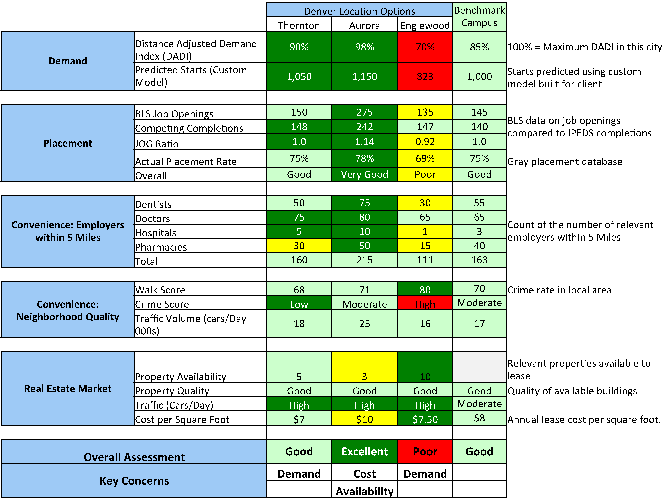
7. One-Page Summary
Perhaps the most important deliverable we provide is a summary of each location, including: Max DADI score, predicted starts, cannibalization (if you have more than one campus in an area), employment, walk score, crime, and other factors. This page allows the senior team to make an efficient, fact-based decision on the best option for a new location.